Everyone has their own way of tracking SEO performance.
Some teams use Looker Studio. Some rely on Power BI, BigQuery, or custom dashboards. If you’re working in a larger organization, those tools make complete sense.
But I still prefer tracking almost everything in a Google Sheet.
My process isn’t revolutionary. It’s actually very simple.
I just like having all the important SEO and business KPIs in one place because it gives me enough room to change the reporting structure whenever I need to. If I want to analyse something differently next month, I don’t have to rebuild an entire dashboard. I can simply add a few columns or rows and continue.
This is the KPI tracking system I’ve gradually built while working on SaaS and other SEO projects over the years.
It starts with publishing data
Before looking at rankings or traffic, I like to know what actually went live during the month.
So the first section of my sheet tracks publishing activity.
Depending on the project, this could include:
- Web pages
- Blog posts
- Case studies
- Service pages
- Landing pages
- Product pages
- Feature pages
- Glossaries
It sounds simple, but it gives context to everything that follows.
If organic traffic grows, was it because we published more content? If leads dropped, did we actually ship anything that month?
Without this context, performance numbers don’t tell the full story.
Google Search Console metrics
The next section comes from Google Search Console.
Apart from the usual clicks and impressions, I also break the data down into smaller buckets.
For example, I track:
- Total clicks
- Total impressions
- Branded clicks
- Non-branded clicks
- Homepage clicks
- Blog folder clicks
- Case study clicks
- Indexed pages
- GSC Queries
- Cluster wise Content Grouping Data
I prefer segregating data by folder structure because it helps answer questions like:
- Which section of the website is driving the most traffic?
- Which content type is growing?
- Which folders deserve more investment?
I also compare this with lead data later to understand which sections of the website aren’t just attracting visitors but are actually generating business.
Bing Webmaster Tools
Bing has become more interesting over the last couple of years, so I don’t ignore it anymore.
I track similar metrics there as well:
- Clicks
- Impressions
- Branded vs non-branded clicks
- Country-specific clicks
- Queries
Recently, Bing also introduced AI-related metrics like:
- Total citations
- Average cited pages
So those have become part of my monthly tracking as well.
Google Analytics 4
Traffic alone isn’t enough.
I also want to know how users behave once they arrive.
From GA4, I usually track:
- Total users
- Organic Search
- Direct
- Referral
- Paid
- Unassigned traffic
Then I look at engagement metrics like:
- Sessions
- Average engagement time
- Engagement rate
- Bounce rate
- Views per session
- Returning users
If a project uses a cookie banner, I also keep track of:
- Pageviews
- Total cookie consents
- Accepted
- Rejected
- Partial consent
Sometimes you’ll notice a sudden drop in tracked users or sessions. Before assuming traffic has declined, I always check whether a consent implementation or tracking change is responsible.
That’s exactly why I like keeping notes alongside the numbers.
Tracking LLM traffic
One section I’ve added recently is LLM traffic.
Using a custom GA4 Exploration report with regex, I track:
- Total LLM traffic
- ChatGPT
- Gemini
- Claude
- Perplexity
- Copilot
- Grok
- Other AI assistants
Along with that, I also monitor:
- LLM sessions
- Engaged sessions
- Average session duration
- Top countries sending LLM traffic
It’s still early, but I think this data will become increasingly important over time.
Note: Google has introduced AI as a channel in GA4 as well as giving impressions from AI overviews in GSC as of July 2026
CRM data
SEO shouldn’t stop at clicks.
I also pull data from whichever CRM the client is using—whether that’s HubSpot, Salesforce, Zoho, or something else.
This includes:
- Raw leads
- Qualified leads
- Opportunities
I also break these down by acquisition channel.
For example:
- Organic Search
- Direct
- Referral
- Paid Search
- Other campaigns
This helps answer the question that matters most:
Which channels are actually generating qualified business, not just traffic?
For this report sometimes I also include data from Pagewise Lead Data Analysis as well as I note down any insights I get from sales call data analysis.
Ahrefs/Semrush metrics
Alongside traffic and leads, I also keep an eye on a few SEO-specific metrics. These are third party tools but still give me basic idea of my site’s performance as compared to competitors because I only have these 3rd party tools to benchmark competitor performance. Although that has become more complex as these days competitors get a whole lot of leads from various channels like LLMs and AIO that relying on these tools without understanding the accuracy part these tools are useless.
For example:
- Organic keywords
- Referring domains
- USA keyword growth (or whichever country we’re targeting)
- Keywords ranking between positions 1–3
- Positions 4–10
- Positions 11–20
Looking at these buckets every month makes it much easier to spot trends before they become obvious in traffic.
Google Updates
One small section that has saved me countless times is Google Updates.
Whenever Google rolls out a Core Update or another major algorithm update, I note it directly in the KPI sheet.
Months later, if somebody asks why traffic changed, I don’t have to rely on memory.
The context is already there.
The two columns I learnt from a SaaS client
One of my clients introduced two simple columns that I’ve continued using ever since.
What Worked
Whenever we make a meaningful change that produces positive results, I note it here.
For example:
- Improved internal linking
- Updated important pages
- Built contextual backlinks
- Improved page structure
Over time, this becomes a playbook of things worth repeating.
What Didn’t Work
Not every experiment succeeds.
Maybe we implemented a particular schema type.
Maybe we changed a page layout.
Maybe we tried a content format that didn’t move the needle.
Instead of forgetting those experiments, I document them.
Sometimes knowing what doesn’t work is just as valuable as knowing what does.
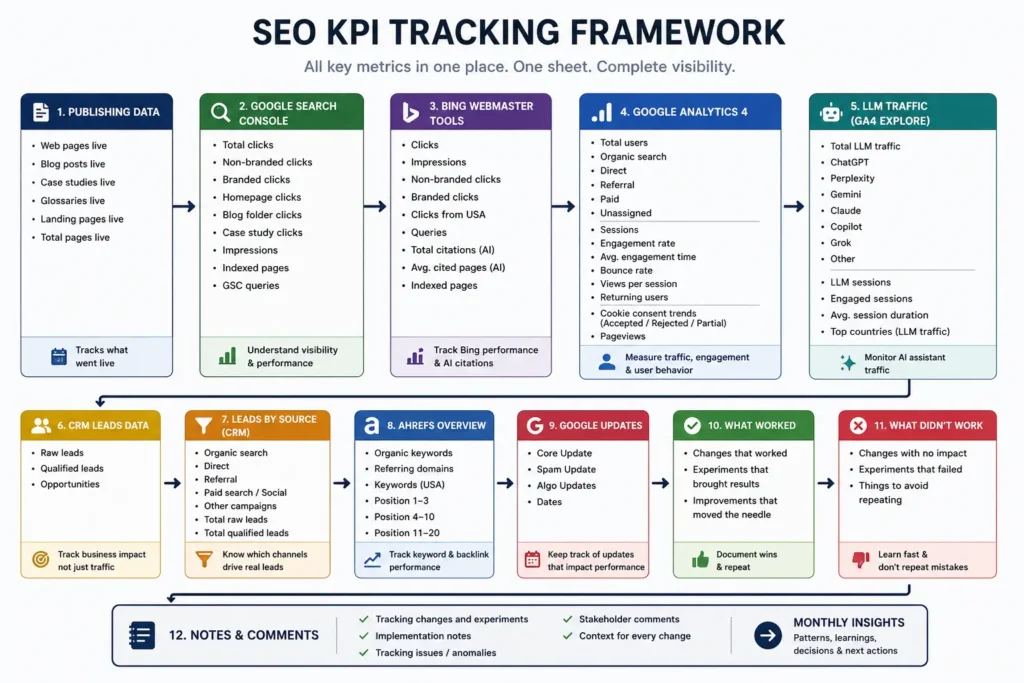
Why I keep everything in one sheet
The biggest reason I keep all these KPIs together isn’t reporting.
It’s pattern recognition.
When publishing data, Search Console, GA4, CRM data, Bing, Ahrefs and AI traffic all live in one place, I start noticing relationships that I’d probably miss if I were jumping between five different dashboards.
I can also change the reporting structure whenever I need to.
If a stakeholder asks a new question, I don’t have to wait for someone to rebuild a dashboard. I simply reorganize the sheet.
I also leave comments and notes throughout the document.
For example, if cookie consent implementation changes the way GA4 collects data, I note it down. If tracking breaks for a week, I document that too.
Months later, those notes become incredibly valuable when you’re trying to explain why a metric suddenly changed.
Final thoughts
I know there are better and more sophisticated ways to do KPI reporting.
If you’re working with massive datasets, BigQuery, Looker Studio or Power BI will probably make more sense.
This is simply the system that has worked well for me over the years.
It’s not about building the perfect dashboard.
It’s about having all the information I need in one place so I can spot patterns, understand what’s really changing, and explain performance with confidence.
What does your KPI tracking process look like?
Do you prefer dashboards, spreadsheets, or a combination of both?
I’d genuinely be interested to know how other SEO professionals organize their reporting.